Operating from the admin
Audit timeline, health, backups, mailer, and other day-two screens.
Updated
Beyond data and users, the admin console is where you run and observe the instance day to day. These screens live under the Logs and Settings tabs.
Audit timeline
Logs is a unified, tamper-evident audit timeline: who did what, when, and whether it succeeded. Filter by action, actor type (system / admin / user / token / job), outcome (success / denied / error), entity, request id, and time range. Click a row to see the full context and a before/after JSON diff of the change.
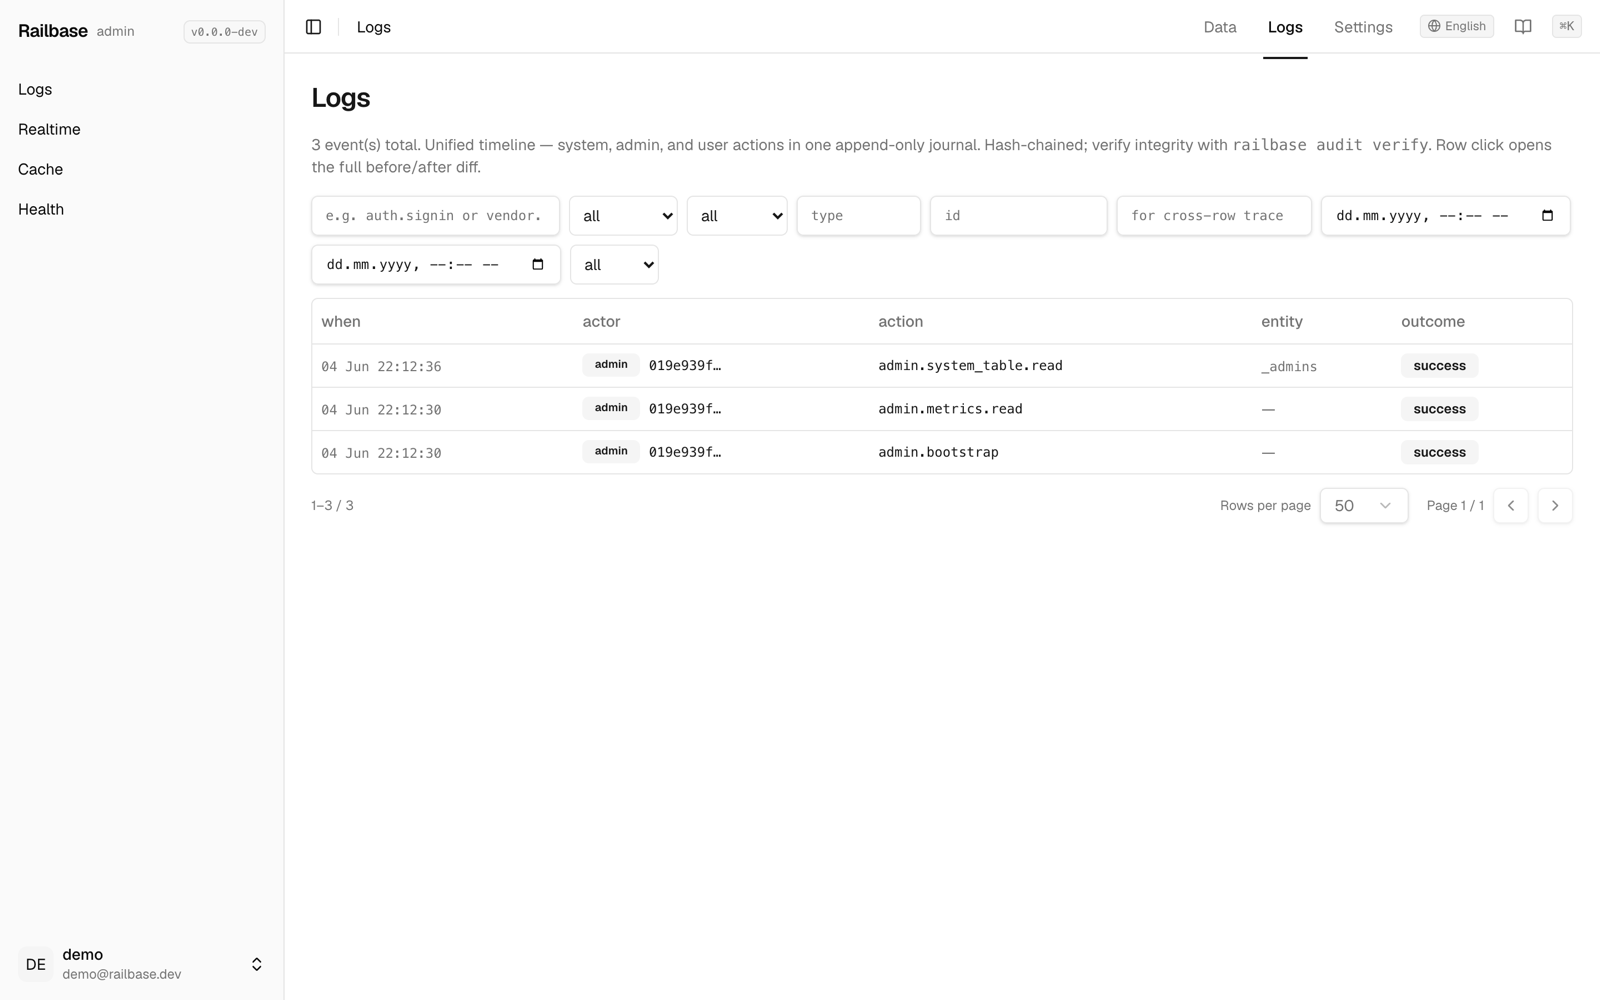
Try it: Operating from the admin — logs, health, backups, mailer
- Logs is a tamper-evident audit timeline — who did what, when, and whether it succeeded. go to /_/logs/timeline
- Filter by actor, outcome, entity, or time range; click a row for a full before-and-after diff. hover Logs
- Process logs give you the structured application stream with a live tail and level filter. go to /_/health/process-logs
- Health and metrics shows runtime, jobs, cache, and live request and latency charts. go to /_/logs/health
- Memory, goroutines, pool connections, and P95 latency, all updating live. hover MEMORY
- Under Settings, Backups lists your snapshots and creates one with a click. go to /_/settings/backups
- Restore is guarded behind a typed confirmation; recurring schedules live on the Scheduler screen. hover Create backup
- And the Mailer screen configures delivery, edits templates, and sends a test email. go to /_/settings/mailer
- Pick SMTP or console, then verify it before you rely on it. hover Configure mailer
Tip
The audit log is hash-chained. Verify its integrity end-to-end with
railbase audit verify.
Health & monitoring
- Health & metrics — runtime, job, cache, and backup status plus HTTP request-rate and latency charts (live).
- Jobs (
/_/logs/jobs) — the background-job queue: inspect, retry, cancel, or run a job now. - Realtime monitor — a read-only view of current subscriptions.
- Cache inspector — per-cache size and hit-rate, with a clear button.
- Process logs — the structured application log stream, with level filter and live tail.
Backups & scheduling
Settings → Backups lists your snapshots and lets you create one with a
click (it is now a read-only archive list plus a create button). Recurring
schedules — including scheduled backups — moved to a dedicated Settings →
Scheduler screen (/_/settings/scheduler), where you add, edit, pause, and
run persisted cron jobs. Restore is intentionally guarded:
Caution
Restore overwrites live data. UI-side restore is default-deny: the Restore
action stays hidden unless RAILBASE_ENABLE_UI_RESTORE=true is set and the
admin has restore permission. When enabled, Railbase requires a dry-run,
confirm-by-filename, maintenance mode, and audit logging. CLI restore remains
available while the server is stopped: railbase backup --restore <file.vault>.
See Backups & restore.
Mailer
Settings → Mailer configures delivery (SMTP or console), edits templates, and shows the delivery log. Use Send test email to verify your SMTP settings before relying on them.
Other settings screens
- Scheduler — persisted cron jobs (scheduled backups, cleanup sweeps, your own). See The scheduler.
- System update (
/_/settings/system-update) — check the running vs latest version and run an in-place binary self-update, with rollback. See Updating. - Files — browse stored files and blobs.
- Trash — restore soft-deleted records across collections.
- i18n — edit translations and seed new locales.
- Hooks — edit your JavaScript hooks in-browser.
- Security — a read-only audit of your boot/config hardening (what's set, what's risky, how to fix). Pair it with Security hardening.
- Webhooks, Stripe — each has its own screen when you use those features.
The Marketplace, Tenants, and Documents screens live on the Data tab (not Settings) — see Installing plugins and Data & multi-tenancy.