The admin console
Sign in, find your way around, and the three working areas of the UI.
Updated
Every Railbase instance ships with a full admin console at /_/ — a
single-page app embedded in the binary. It's where you manage data, users,
settings, logs, and backups without writing any code.
Signing in
Go to http://your-host/_/. Sign in with an admin account (create one with
railbase admin create you@example.com — see Quickstart). If the
account has two-factor enabled, you'll be prompted for a 6-digit code; you can
also use a recovery code. On a brand-new install with no admins yet, the screen
points you at the admin create command, and a one-step setup wizard is available
at /_/bootstrap.
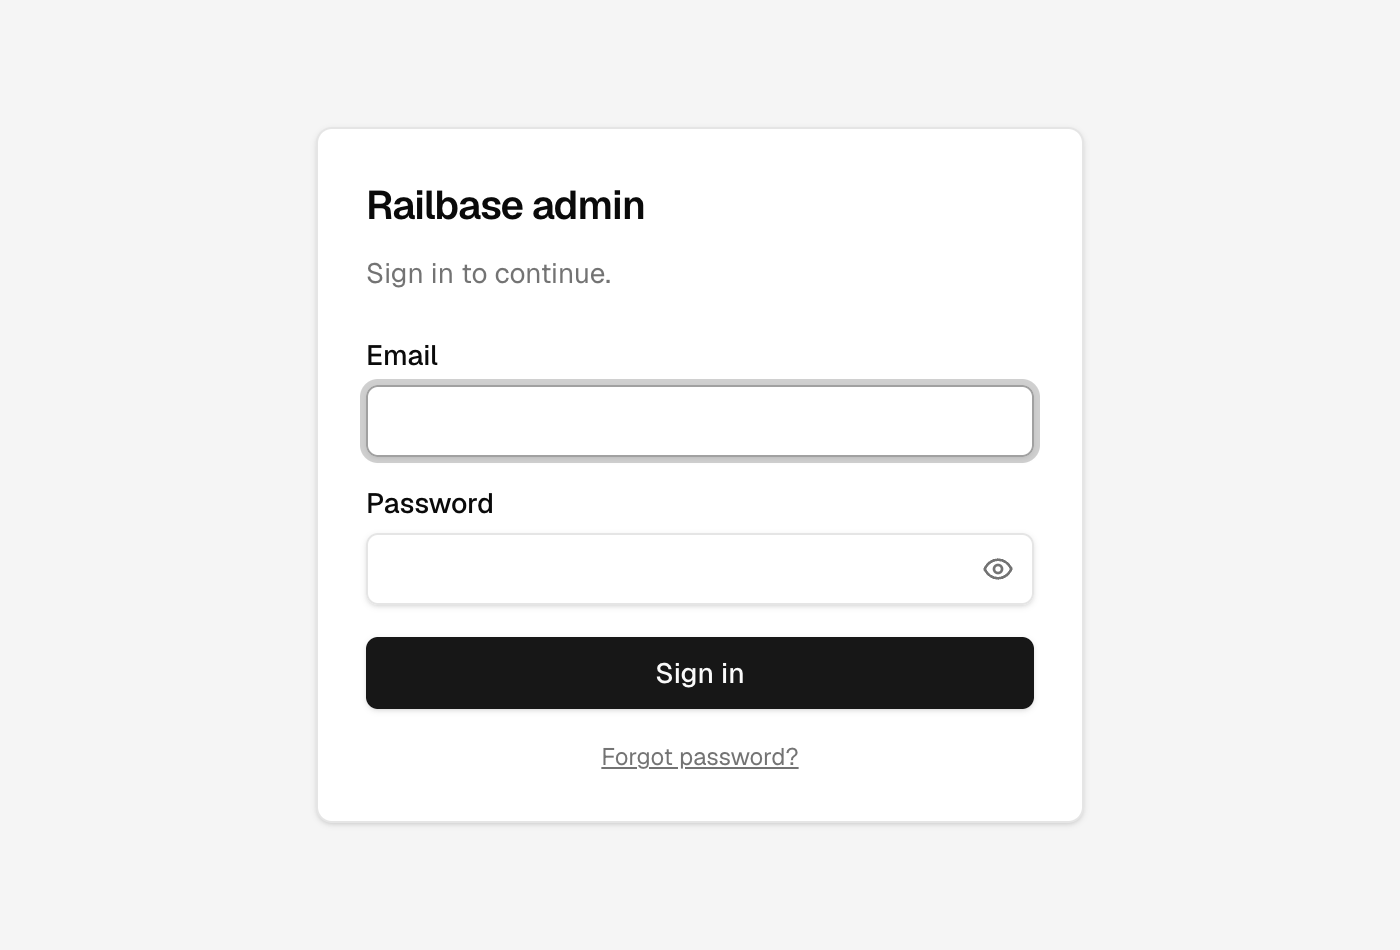
Try it: Signing in
- Head to slash-underscore-slash and you reach the sign-in screen. go to /_/login
- Enter your admin email. type “admin@example.com” into Email
- And your password. type “AdminP@ss123” into Password
- Sign in, and you're in the console. click “Sign in”
Getting around
The console is organized into three top tabs, each with its own sidebar:
| Tab | What's there |
|---|---|
| Data | Your collections, the schema editor, records, and system tables |
| Logs | The audit timeline, realtime monitor, health/metrics, cache |
| Settings | Auth, mailer, users & roles, backups, webhooks, marketplace, and more |
Try it: A tour of the console
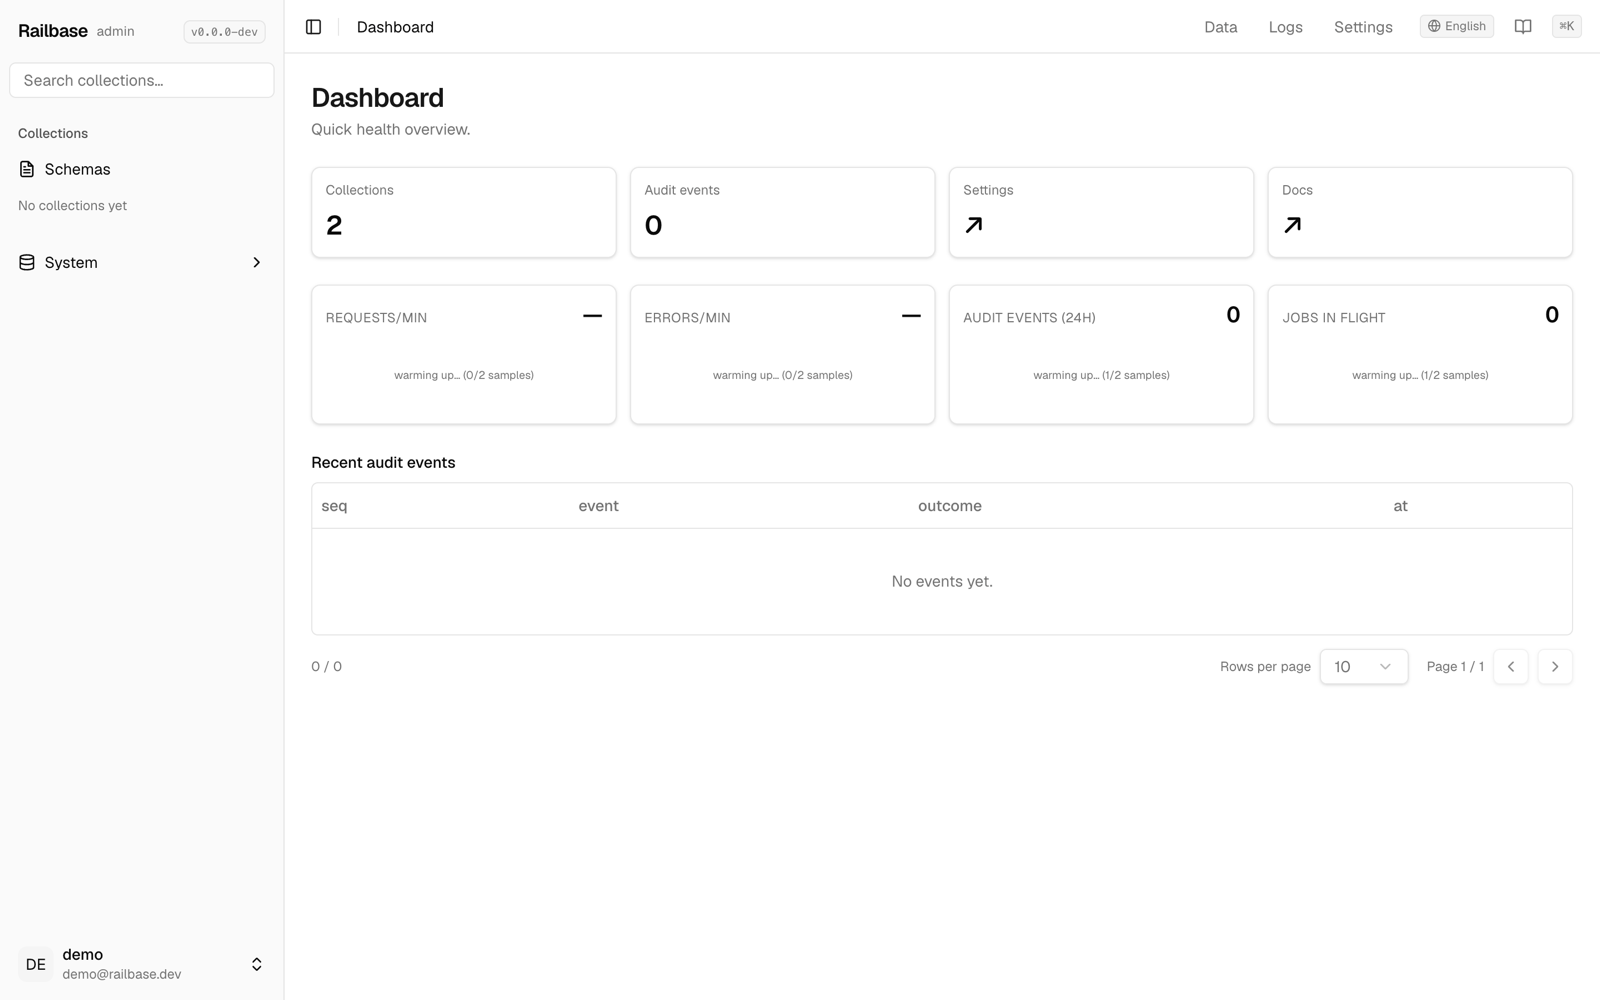
- The console opens on the Dashboard — a quick health overview of your instance. go to /_/
- The top cards show your collection count and recent audit events. hover Collections
- Live request and error rates update as traffic flows. hover Requests/min
- The Data tab is your working database — collections, the schema editor, and records. go to /_/data/posts
- Here's the posts collection — filter, sort, and inline-edit, right in the grid. hover Welcome to Railbase
- The Logs tab is a tamper-evident audit timeline of every action. go to /_/logs/audit
- Health and metrics shows runtime, jobs, and live request and latency charts. go to /_/logs/health
- Memory, goroutines, and P95 latency, refreshed every few seconds. hover MEMORY
- And Settings is where auth, the mailer, backups, and more all live. go to /_/settings
Other chrome:
- A language switcher (the admin is localized into 10 languages).
- A Docs button (book icon) opening the in-product documentation at
/_/docs. - A ⌘K command palette for jumping anywhere quickly.
- The version chip in the sidebar header — hover for build details, click for health.
- Your account menu in the sidebar footer: account settings and sign out.
Note
Dark mode follows your operating system automatically — there's no manual theme toggle.
Where to go next
- Managing data — collections, records, import/export.
- Users & access — users, roles, auth methods, API tokens.
- Operating from the admin — logs, backups, mailer, and health.
Tip
The admin is powerful — keep it off the public internet or behind your network boundary. See Security.